# Dashboards

{% hint style="success" %}
To start analysis using the dashboard view the current project must have at least one model that has been:

* [Uploaded to the platform](https://docs.tensorleap.ai/tensorleap-integration/uploading-with-cli/cli-assets-upload#uploading-a-model)
* [Validated](https://docs.tensorleap.ai/user-interface/project/network/network-mapping/validate-mapping)
* [Evaluated](https://docs.tensorleap.ai/user-interface/project/menu-bar/evaluate-a-model)
  {% endhint %}

<figure><img src="https://3509361326-files.gitbook.io/~/files/v0/b/gitbook-x-prod.appspot.com/o/spaces%2F9UXeOlFqlw8pl79U2HGU%2Fuploads%2FRJmyfiVe70QtF61y2Cna%2Fimage.png?alt=media&#x26;token=bda4d70f-ae52-4012-bd4c-6a69f2b88d52" alt=""><figcaption><p>The dashboard view. Marked are the dashboard name, add new dashlet panel, and the tabs (insights/issues/tests)</p></figcaption></figure>

The Dahboard view is the view in which all Model analysis is made within the platform. This view supports multiple dashlets: [population exploration](https://docs.tensorleap.ai/user-interface/project/dashboards/dashlets/population-exploration), [metrics related](https://docs.tensorleap.ai/user-interface/project/dashboards/dashlets/metrics-dashboard), [sample analysis](https://docs.tensorleap.ai/user-interface/project/dashboards/dashlets/sample-analysis) - each of these enables a separate analysis flow.

In addition, it offers a suite of capabilities:

* The [insights](https://docs.tensorleap.ai/user-interface/project/dashboards/insights) panel - that pinoints to sepcific model & data failures
* The [issues](https://docs.tensorleap.ai/user-interface/project/dashboards/issues) panel - that supports an in-platform log of detected failures, and enables team collaboration around the solution of such failures.
* The [tests](https://docs.tensorleap.ai/user-interface/project/dashboards/tests) panel - that support an in-platform tracking of important failure cases and allows a one-click overview to test for model regressions.

### Adding and removing  a model from analysis

<figure><img src="https://3509361326-files.gitbook.io/~/files/v0/b/gitbook-x-prod.appspot.com/o/spaces%2F9UXeOlFqlw8pl79U2HGU%2Fuploads%2F3qlLDA8C4vdgQld2nhiM%2FKapture%202025-07-06%20at%2008.36.27.gif?alt=media&#x26;token=c4c504fe-d141-49a4-983c-f3b704483c12" alt=""><figcaption><p>Adding and removing models from analysis</p></figcaption></figure>

To add or remove models from the analysis, we use the [versions](https://docs.tensorleap.ai/user-interface/project/versions) tab. Next to each model run version that was previously [evaluated](https://docs.tensorleap.ai/user-interface/project/menu-bar/evaluate-a-model) within tensorleap, there's an "Add To Dashboard" button. Clicking the button adds the model to the dashboard, populating all existing dashlets, insights, and tests using the added model.

The currently examined model runs could be seen in color-coded cards at the top of the dashboards. Each dashlet would be split according to the number of models concurrently examined.

To remove a model that was added to the analysis, either click the "x" button next to its card at the top, or click the corrosponding "Add To Dashboard" icon again to deselect it.

### Adding Dashlets

<figure><img src="https://3509361326-files.gitbook.io/~/files/v0/b/gitbook-x-prod.appspot.com/o/spaces%2F9UXeOlFqlw8pl79U2HGU%2Fuploads%2Fwko0STHJtCi64VCvCQ6J%2FKapture%202025-07-06%20at%2008.42.43.gif?alt=media&#x26;token=026bf854-38a6-47f9-87ce-32dc4e55c591" alt=""><figcaption><p>Adding a new dashlet in Tensorleap</p></figcaption></figure>

Adding a dashlet is done from the "Add New Dashlet" dropdown in the top right. Available dashlets for adding are:

* [Metrics and plots dashlets](https://docs.tensorleap.ai/user-interface/project/dashboards/dashlets/metrics-dashboard)
* [Population exploration](https://docs.tensorleap.ai/user-interface/project/dashboards/dashlets/population-exploration)
* [Sample analysis](https://docs.tensorleap.ai/user-interface/project/dashboards/dashlets/sample-analysis)

### Creating multiple dashboards

<figure><img src="https://3509361326-files.gitbook.io/~/files/v0/b/gitbook-x-prod.appspot.com/o/spaces%2F9UXeOlFqlw8pl79U2HGU%2Fuploads%2Ff3ceXpLdnkG021szqNCG%2Fimage.png?alt=media&#x26;token=e0a363ed-c1ad-4443-a48a-011f458ee91d" alt=""><figcaption><p>
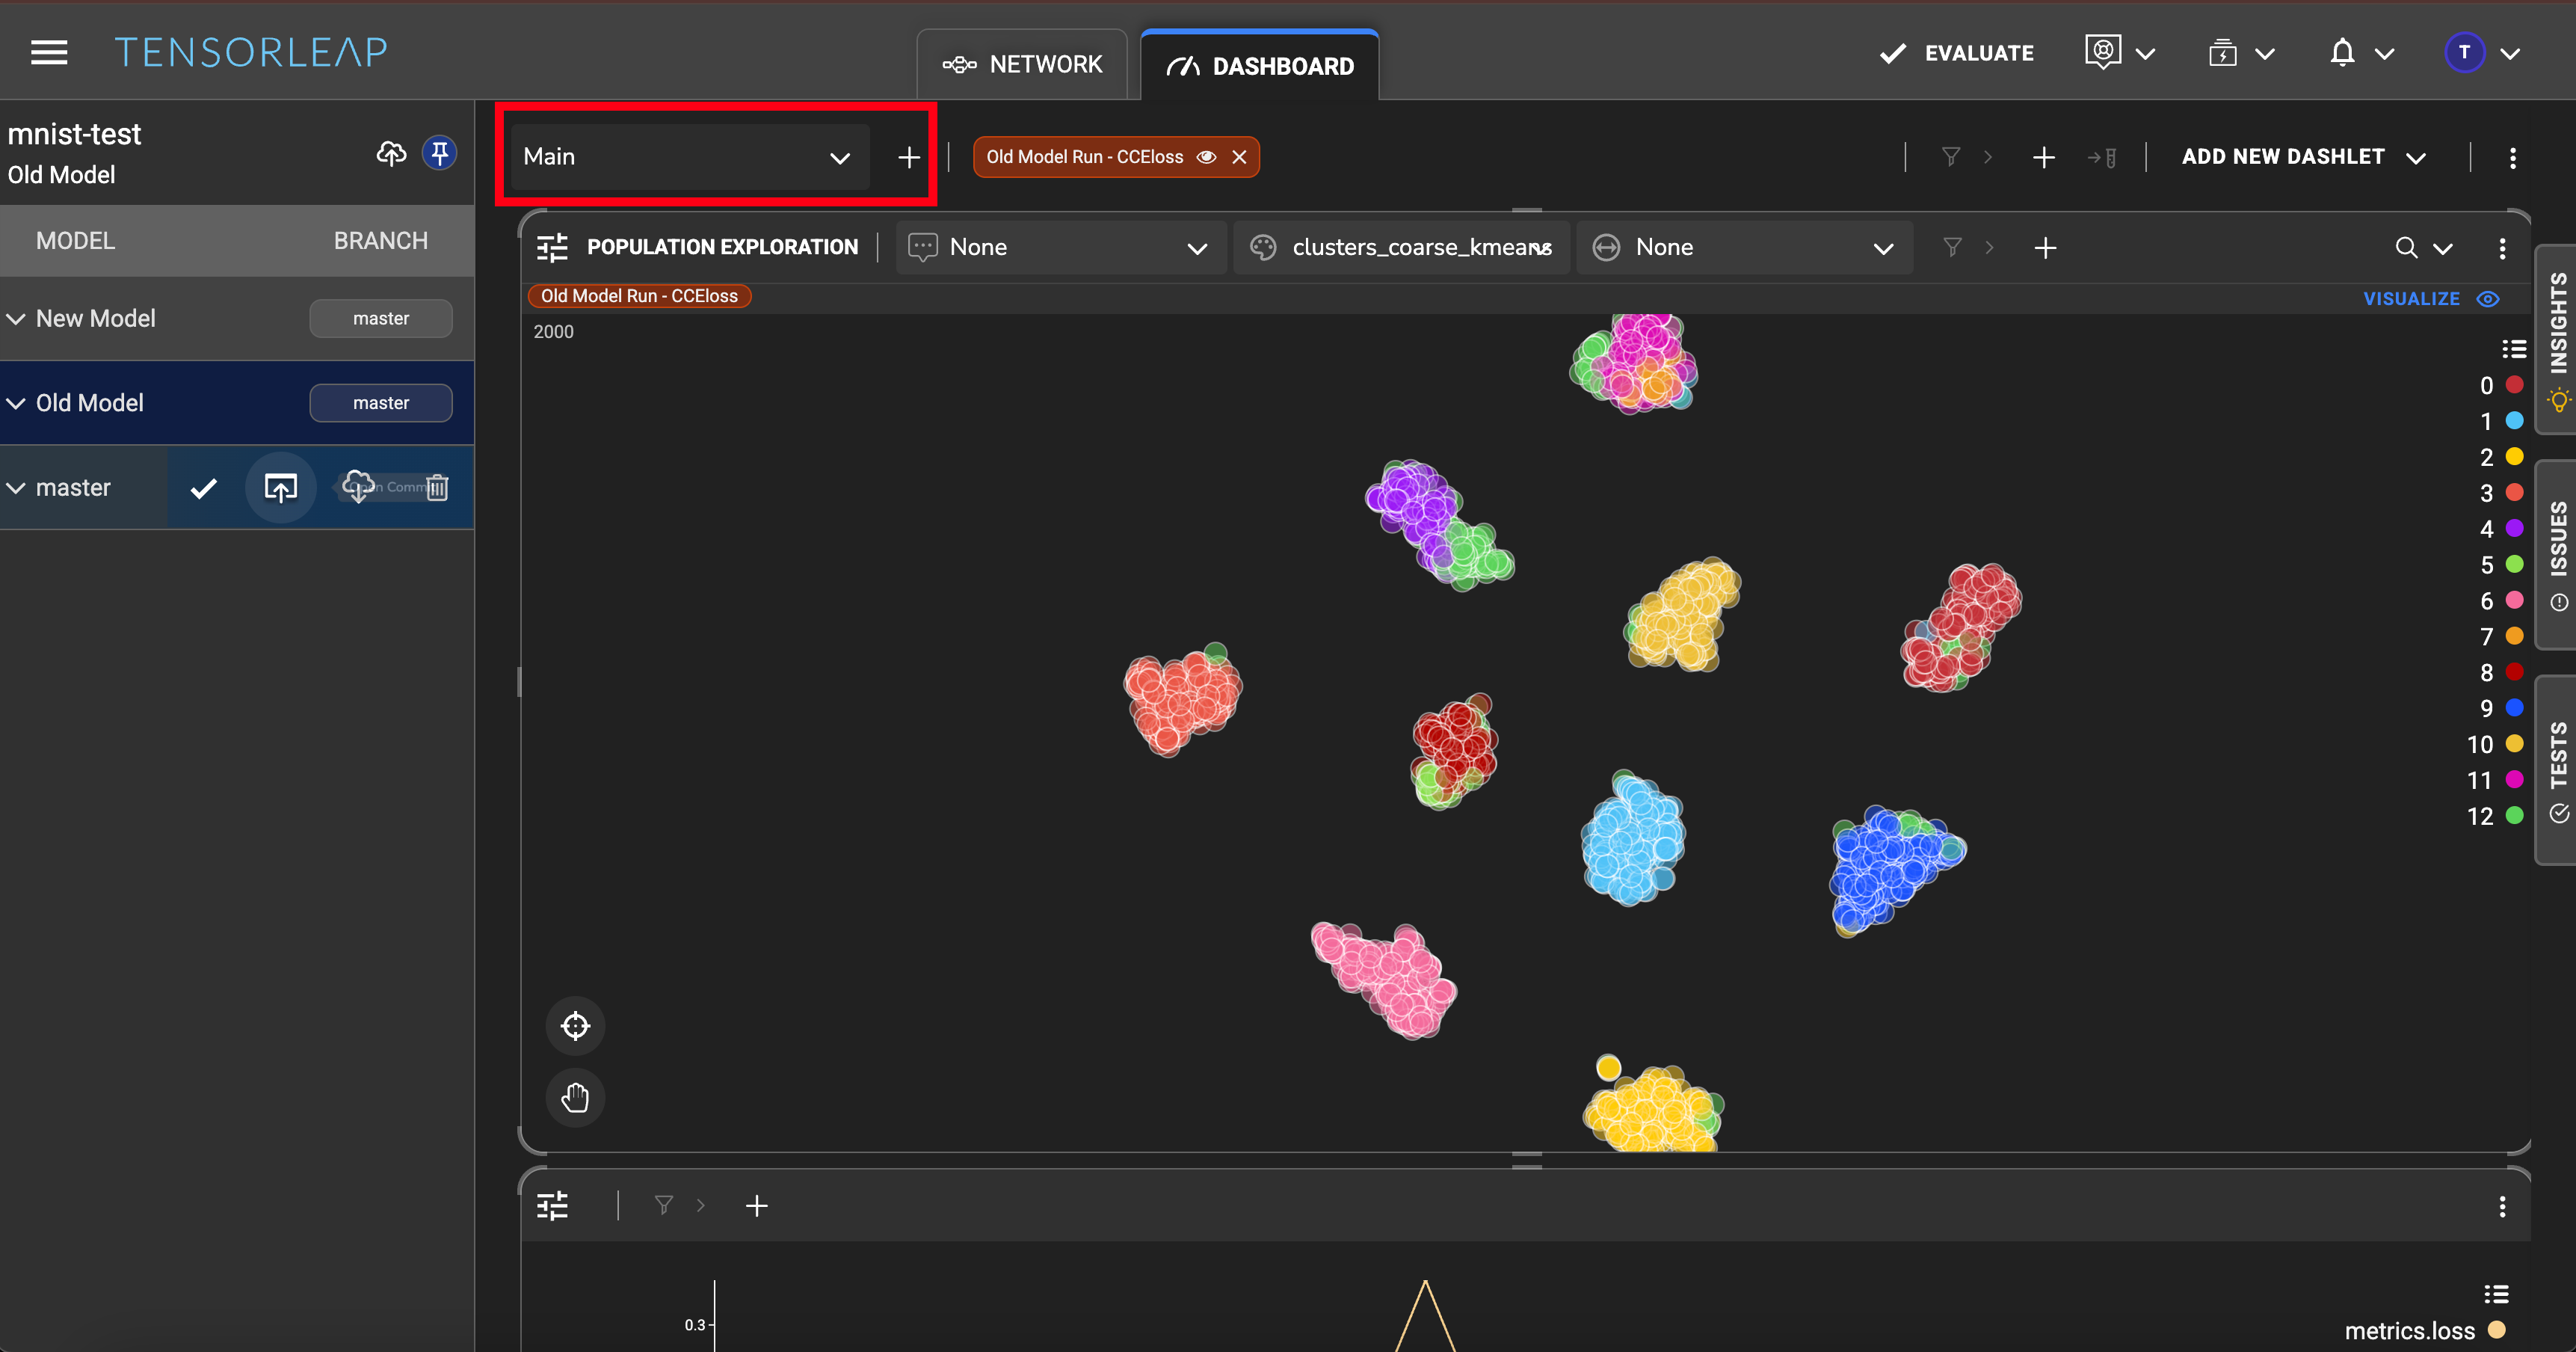
Dashboard selection panel</p></figcaption></figure>

A project can hold more than one dashboard. To add a dashboard, click the "+" icon in the top left othe dashboard. To switch between dashboards, click the dropdown panel in the top left side of the dashboard.
