F1 metric Dashlet
 at the top bar.
#### Selected Models
The dashboard displays visualizations of the currently selected model(s). To select models, click
at the top bar.
#### Selected Models
The dashboard displays visualizations of the currently selected model(s). To select models, click  to open the Versions panel on the left, expand the version, and select the model(s).
The dashboard will automatically update and show data for the selected models. At the top bar, you can see tags with the selected models. From there, you can also toggle to filter models.

## Dashlet
A **Dashlet** is an interactive visualization that updates in real-time, displaying aggregated metrics against various parameters. To add a new **Dashlet** click
to open the Versions panel on the left, expand the version, and select the model(s).
The dashboard will automatically update and show data for the selected models. At the top bar, you can see tags with the selected models. From there, you can also toggle to filter models.

## Dashlet
A **Dashlet** is an interactive visualization that updates in real-time, displaying aggregated metrics against various parameters. To add a new **Dashlet** click  and choose the chart type on the left.
The different Dashlet types, and their properties, are described below.
### Bar

| Property | Description |
| ----------------- | --------------------------------------------------------------------------------------------------------------------------------------------------------------------------------------------------------------------------------------------------- |
| `Dashlet Name` | The Dashlet's title |
| `Y-axis` | Points to the metric that is correlated with the bars' height |
| `Aggregation` | Mathematical operation for aggregating the presented data: Average, Min, Max, Mid, Count |
| `Scale Y` | Whether to use a linear, log, or exponential factoring to the data |
| Data Distribution |
and choose the chart type on the left.
The different Dashlet types, and their properties, are described below.
### Bar

| Property | Description |
| ----------------- | --------------------------------------------------------------------------------------------------------------------------------------------------------------------------------------------------------------------------------------------------- |
| `Dashlet Name` | The Dashlet's title |
| `Y-axis` | Points to the metric that is correlated with the bars' height |
| `Aggregation` | Mathematical operation for aggregating the presented data: Average, Min, Max, Mid, Count |
| `Scale Y` | Whether to use a linear, log, or exponential factoring to the data |
| Data Distribution | ContinuousDistinct
Order-By: Metric / AlphabeticalOrder: Ascending / DescendingHow to split the dashlet to compare different subsets/models/metadata (horizontally, vertically, inner)
Split by Model - How would model comparison split dashlet.Field: selected field to be represented by the heat-map's colorAggregation: mathematical operation for aggregating the presented data: Average, Min, Max, MidField: selected field to be represented by the x-axisDistribution
ContinuousDistinct
Order-By: Metric / AlphabeticalOrder: Ascending / DescendingField: selected field to be represented by the y-axisDistribution
ContinuousDistinct
Order-By: Metric / AlphabeticalOrder: Ascending / DescendingHow to split the dashlet to compare different subsets/models/metadata (horizontally, vertically, inner)
Split by Model - How would model comparison split dashlet.How to split the dashlet to compare different subsets/models/metadata (horizontally, vertically, inner)
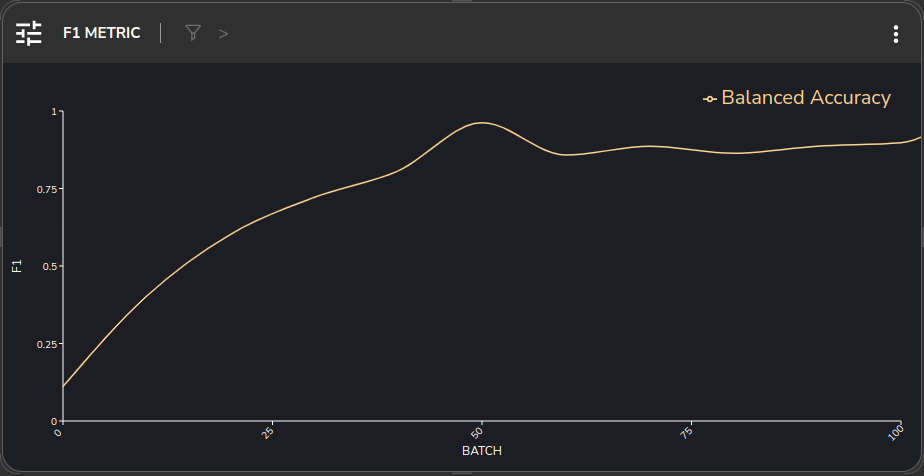
Split by Model - How would model comparison split dashlet.F1 metric Dashlet
ContinuousDistinct
Order-By: Metric / AlphabeticalOrder: Ascending / Descending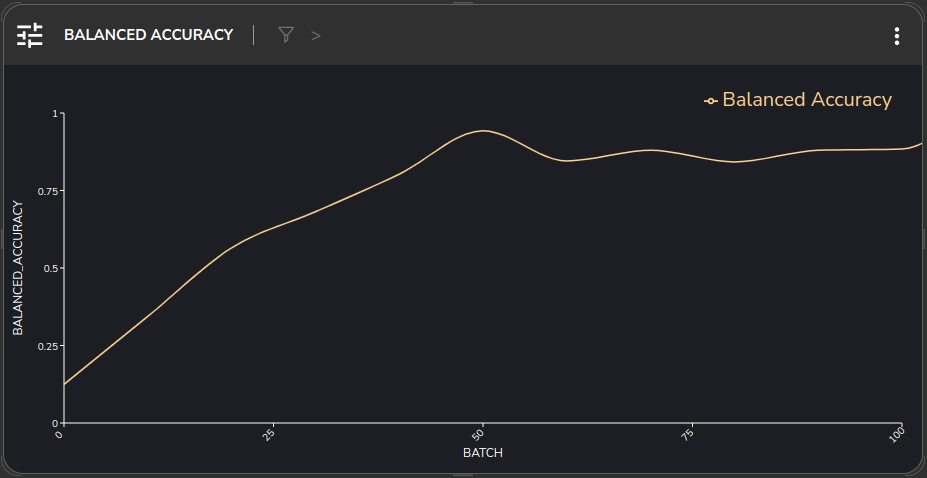
Balanced Accuracy Dashlet
ContinuousDistinct
Order-By: Metric / AlphabeticalOrder: Ascending / Descending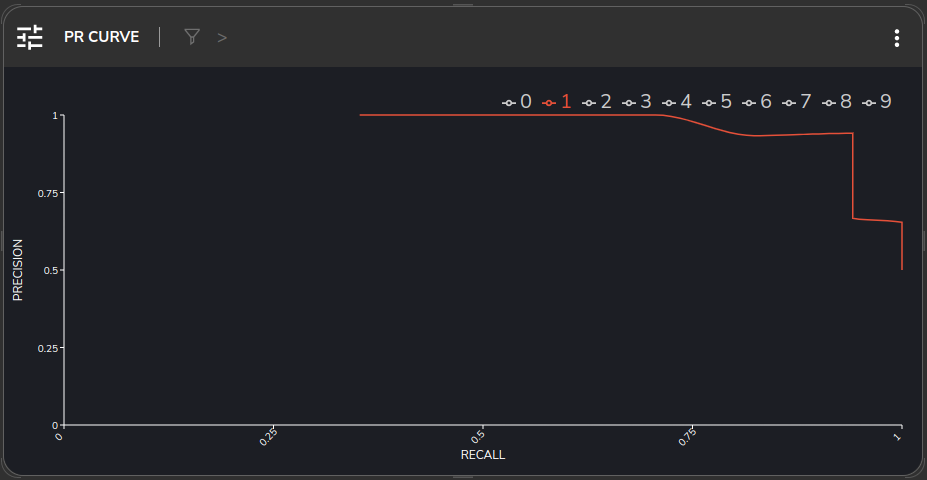
PR Curve Dashlet
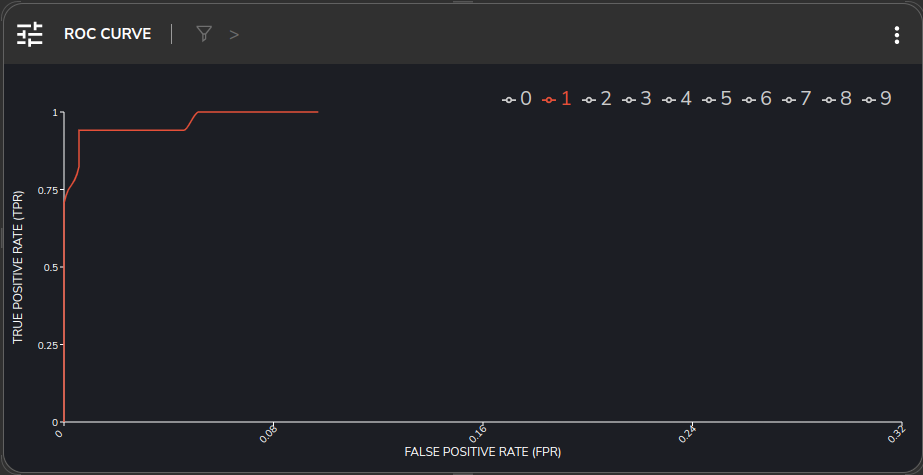
ROC Curve Dashlet